Vantry ATI
Advanced Treasury Intelligence - the complete FX risk management platform for modern businesses.
Access PlatformHedgeCore
Structured evaluation of FX hedging strategies across defined parameters, constraints, and market scenarios. Built for finance teams who need transparency before execution.
Gap Analysis & Coverage
Identify residual exposure across each hedge layer in real time. Coverage dashboards quantify hedged amounts, remaining risk, and forward-looking Value at Risk under defined market conditions.
Probability Assessment
Evaluate forwards, vanilla options, collars, and structured strategies across defined strike and delta ranges. Structures are assessed under probability-weighted performance, downside protection efficiency, and defined risk constraints.
Outcome Comparison
Compare hedge structures across adverse, neutral, and favorable market environments. Probability-weighted analysis highlights downside protection, convexity tradeoffs, and breakeven resilience.
Exposure Profiling
Segment exposures by amount, timing, and direction into discrete hedge profiles. Rolling and fixed-date configurations with target coverage ratios and budget constraints.
Balance Sheet Alignment
Model how hedge structures influence cash flow timing, earnings volatility, and reporting stability. Map foreign assets and liabilities to defined net exposure requirements.
Price Attribution
Premium components clearly attributed, including market inputs and execution margin. Structured visibility ensures pricing is aligned with defined risk parameters and client objectives.
How It Works
Define Exposure Profiles
Define exposure profiles by currency pair, direction, notional, and horizon. Establish coverage targets, budget parameters, and risk tolerance thresholds.
Run the Modeling Engine
The modeling framework evaluates thousands of viable hedge structures across forwards, vanilla options, collars, and barriers using live market inputs.
Compare & Select
Structures are assessed using probability-weighted performance, downside protection efficiency, and cost attribution. Adjust assumptions and compare payoff distributions across market regimes.
Execute & Monitor
Approved structures integrate into live hedge profiles. Coverage dashboards update in real time with VaR, residual exposure tracking, and performance attribution.
RiskCore
Advanced probability-weighted risk analytics supporting HedgeCore decision workflows. Scenario modeling, payoff visualization, and structured performance metrics designed for pre-trade evaluation and governance oversight.
Scenario Analysis
Define spot rate ranges and market assumptions across defined regimes. Evaluate hedge performance under adverse, neutral, and favorable market conditions.
P&L Distribution
Probability-weighted outcome distributions illustrating expected performance, downside thresholds, and benchmark comparisons versus forwards and unhedged exposure.
Risk Quantification
Forward-looking Value at Risk, dispersion metrics, and percentile analysis providing structured visibility into volatility and tail exposure.
Rate Touch Probability
Barrier probability calculations assess the likelihood of spot reaching defined test levels during the contract life under current volatility and drift assumptions.
3D Payoff Surface
Interactive three-dimensional visualization mapping option value sensitivity across spot rate, time to expiry, and P&L dimensions. Illustrates time decay and structural risk exposure across evolving market conditions.
Risk Reporting
Generate client-ready risk reports including probability distributions, scenario analysis, performance metrics, and structured strategy documentation.
How It Works
Select a Quote or Position
Import any quoted or executed hedge structure into the risk framework. Strategy details, option legs, and current market inputs are populated automatically.
Configure Scenario Parameters
Define spot rate ranges and market assumptions across defined regimes. Set level tests, adjust volatility assumptions, and enable benchmark comparisons versus forwards or unhedged exposure.
Analyze the Distribution
The framework evaluates a structured range of spot scenarios using probability-based modeling. P&L distributions, Value at Risk, expected performance, and dispersion metrics are generated in real time.
Export & Present
Generate structured risk reports including probability distributions, performance metrics, and scenario outputs for client presentation, internal review, or compliance documentation.
Market & Valuation Tools
Budget Rate Analysis, MTM Reporting & Stress Testing
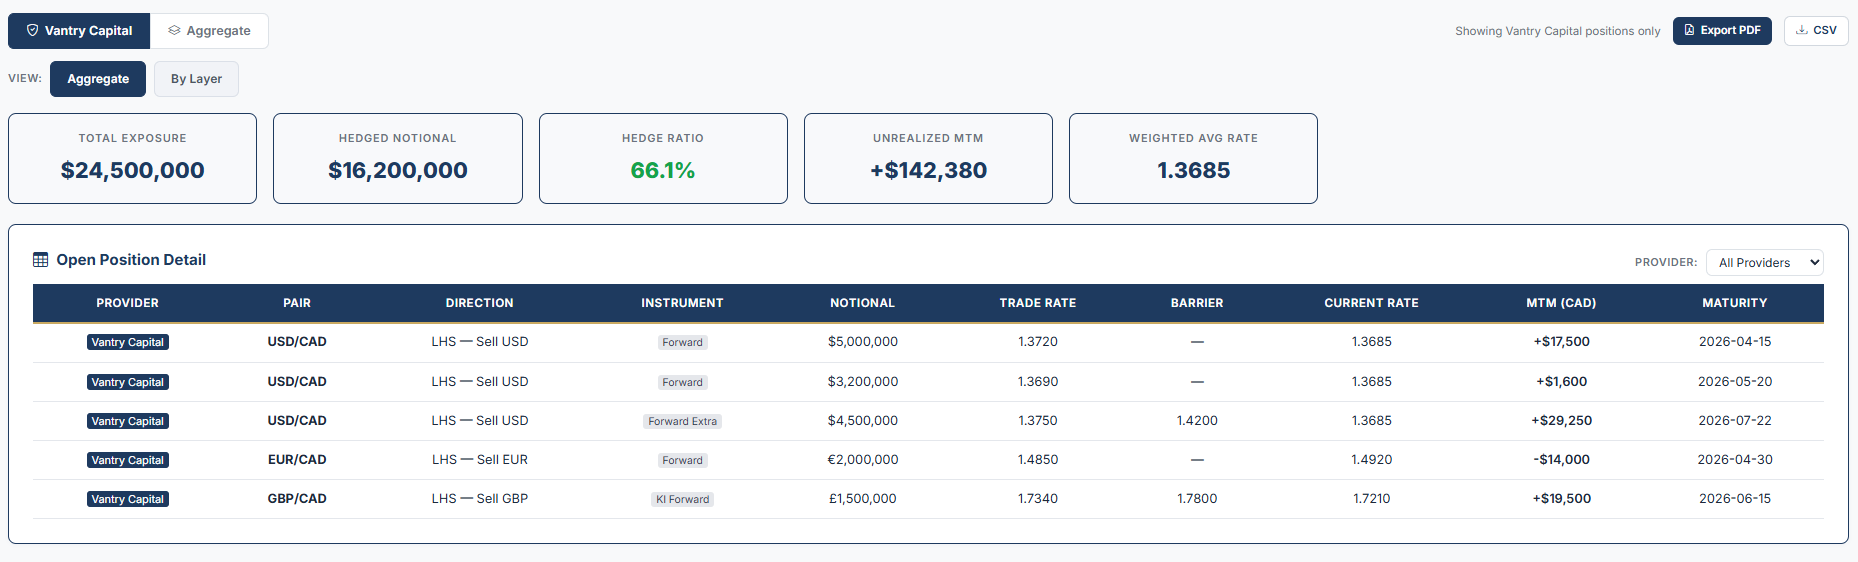
Independent MTM reporting and risk analysis across FX exposures. The module provides transparent valuation and ongoing visibility into the performance of executed hedges relative to market conditions and internal budget rates. Reporting is designed to support financial reporting, internal risk oversight, and ongoing hedge management across positions booked with Vantry and third-party counterparties.
Core Capabilities:
- Position & Portfolio MTM: Real-time valuation across individual contracts and aggregated FX portfolios using current market inputs
- Budget Rate Analysis: Evaluate hedge performance relative to internal budget rates, highlighting realized gains or shortfalls across both hedged and remaining exposures
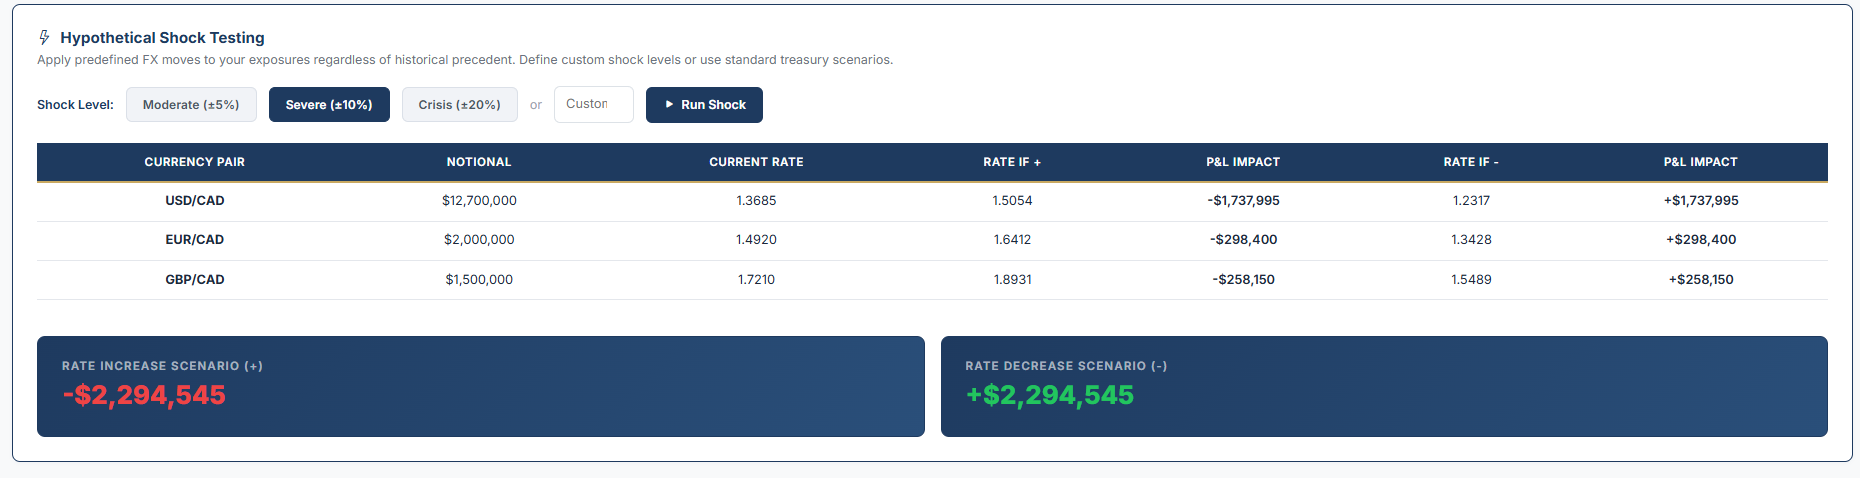
- Scenario & Stress Testing: Model the financial impact of defined market moves across both hedged positions and unhedged exposure to understand potential outcomes under different FX scenarios
- Weighted Rates & Exposure Tracking: Consolidated views of notional exposure, weighted average hedge rates, and remaining open exposure
- Cross-Counterparty Reporting: Unified MTM reporting across trades executed with multiple banking counterparties

Technical Analysis
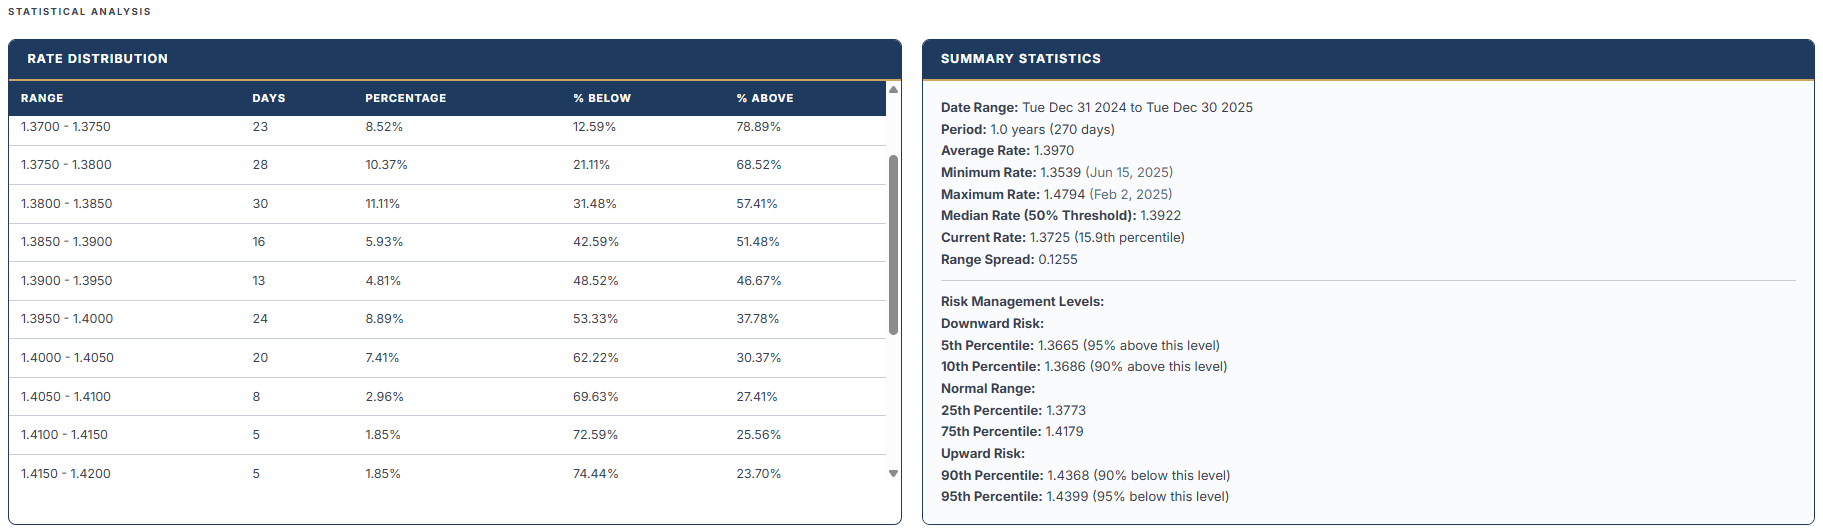
Market context and historical behavior analysis across FX pairs. Technical Analysis provides structured insight into historical price behavior, volatility conditions, and market positioning across major currency pairs. The tools are designed to contextualize current market levels and support informed timing discussions without relying on short-term market predictions.
Core Capabilities:
- Historical Rate Distributions & Percentiles: Analyze where current spot levels sit relative to historical ranges, averages, and percentile thresholds across customizable time periods
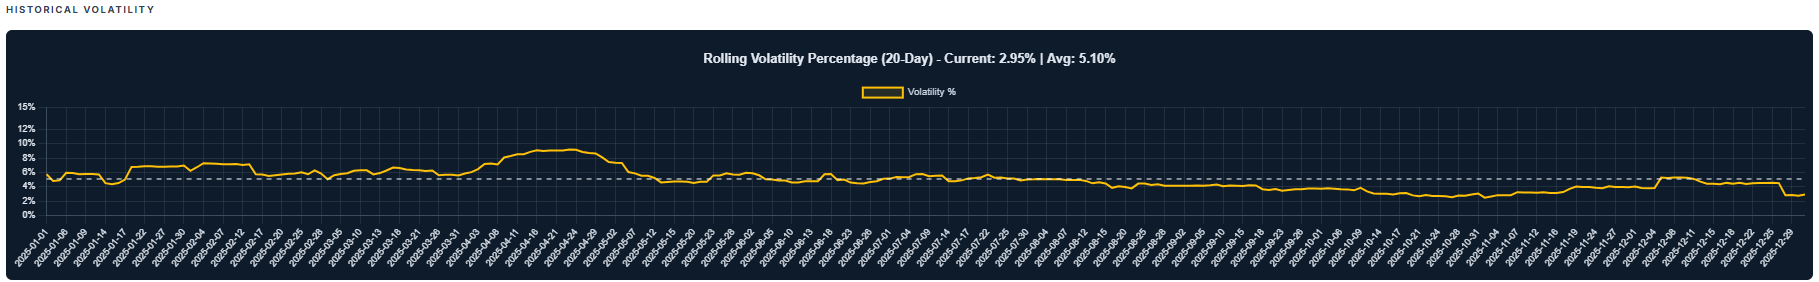
- Volatility & Trend Context: Monitor realized volatility, rolling volatility measures, and prevailing trend direction to assess current market conditions and potential regime shifts
- Support & Resistance Frameworks: Identify statistically derived support and resistance levels across short, medium, and long-term horizons to contextualize market sensitivity
- Momentum & Technical Indicators: Apply commonly used indicators including moving averages, Bollinger Bands, and RSI to evaluate momentum and relative strength
- Seasonality & Period Effects: Review historical monthly, weekly, and quarter-end patterns to understand recurring market behaviors and timing effects
Ready to See Vantry ATI in Action?
Schedule a personalized demo and discover how our platform can transform your FX risk management.
Book Your Demo